Tập tin:England and Wales population cartogram districts.svg

Kích thước bản xem trước PNG này của tập tin SVG: 525×599 điểm ảnh. Độ phân giải khác: 210×240 điểm ảnh | 421×480 điểm ảnh | 673×768 điểm ảnh | 897×1.024 điểm ảnh | 1.795×2.048 điểm ảnh | 1.022×1.166 điểm ảnh.
Tập tin gốc (tập tin SVG, 1.022×1.166 điểm ảnh trên danh nghĩa, kích thước: 805 kB)
Tập tin này từ Wikimedia Commons. Trang miêu tả nó ở đấy được sao chép dưới đây. Commons là kho lưu trữ tập tin phương tiện có giấy phép tự do. Bạn có thể tham gia. |
Miêu tả
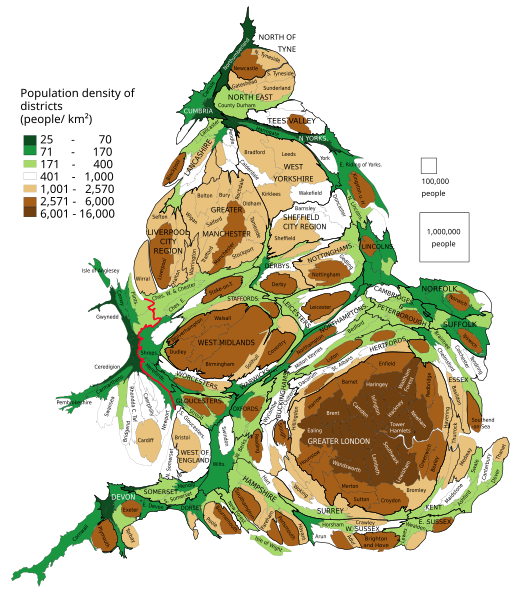
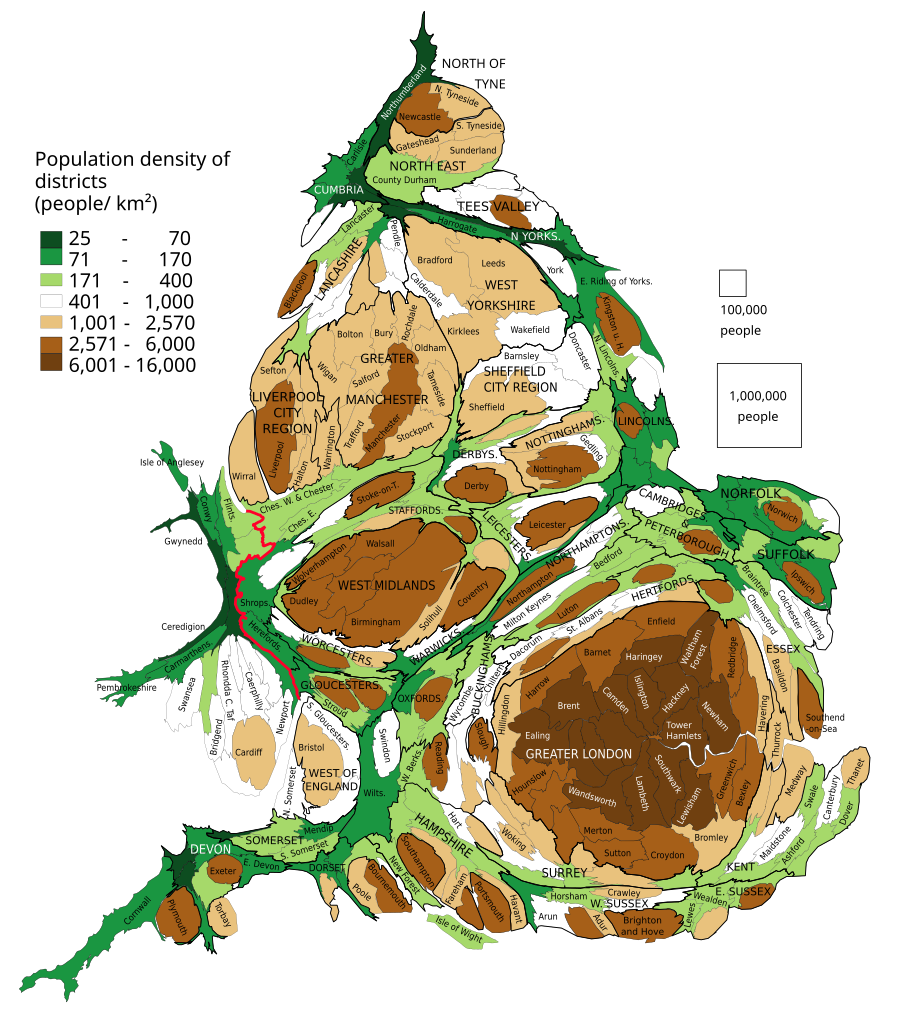
| Miêu tả | English: Population of districts. Their size shows their population, with some approximation, according to 2011 Census data. Each group of squares in the map key is 20 % of total number of districts. Polski: Kartogram ludności Anglii i Walii. Liczba mieszkańców dystryktów. Wielkość dystryktów pokazuje liczbę jego mieszkańców, z pewnym przybliżeniem według danych z cenzusu z 2011. Każda grupa kwadratów w legendzie to 20 % liczby wszystkich dystryktów. |
| Ngày | |
| Nguồn gốc | Own work based on: population density from Population Estimates for UK, England and Wales, Scotland and Northern Ireland - Office for National Statistics, 2015 |
| Tác giả | PawełS |
| SVG genesis |
Software:
- ScapeToad (First grid 1 600; Diffusion grid size 1024; 8 iterations)
- QGIS: Cartogram Creator plugin 10 iterations
Giấy phép
Tôi, người giữ bản quyền tác phẩm này, từ đây phát hành nó theo giấy phép sau:
Tập tin này được phát hành theo Giấy phép Creative Commons Ghi công - Chia sẻ tương tự 3.0 Chưa chuyển đồi
- Bạn được phép:
- chia sẻ – sao chép, phân phối và chuyển giao tác phẩm
- pha trộn – để chuyển thể tác phẩm
- Theo các điều kiện sau:
- ghi công – Bạn phải ghi lại tác giả và nguồn, liên kết đến giấy phép, và các thay đổi đã được thực hiện, nếu có. Bạn có thể làm các điều trên bằng bất kỳ cách hợp lý nào, miễn sao không ám chỉ rằng người cho giấy phép ủng hộ bạn hay việc sử dụng của bạn.
- chia sẻ tương tự – Nếu bạn biến tấu, biến đổi, hoặc làm tác phẩm khác dựa trên tác phẩm này, bạn chỉ được phép phân phối tác phẩm mới theo giấy phép y hệt hoặc tương thích với tác phẩm gốc.
Lịch sử tập tin
Nhấn vào ngày/giờ để xem nội dung tập tin tại thời điểm đó.
| Ngày/giờ | Hình xem trước | Kích cỡ | Thành viên | Miêu tả | |
|---|---|---|---|---|---|
| hiện tại | 17:14, ngày 13 tháng 2 năm 2019 | | 1.022×1.166 (805 kB) | PawełS | combined authorities |
| 21:08, ngày 22 tháng 3 năm 2017 |  | 1.022×1.166 (783 kB) | PawełS | Haringey and Devon font colour | |
| 14:34, ngày 19 tháng 3 năm 2017 |  | 1.022×1.166 (783 kB) | PawełS | + population density | |
| 18:01, ngày 16 tháng 1 năm 2014 |  | 1.024×1.188 (1 MB) | PawełS | Fonts size | |
| 17:49, ngày 16 tháng 1 năm 2014 |  | 1.024×1.188 (1,1 MB) | PawełS | Bold England-Wales border | |
| 20:01, ngày 24 tháng 3 năm 2013 |  | 1.024×1.188 (1,1 MB) | PawełS | Trying to fix fonts appearance in thumb | |
| 18:16, ngày 14 tháng 3 năm 2013 |  | 1.024×1.188 (1,1 MB) | PawełS | User created page with UploadWizard |
Trang sử dụng tập tin
Có 1 trang tại Wikipedia tiếng Việt có liên kết đến tập tin (không hiển thị trang ở các dự án khác):
Sử dụng tập tin toàn cục
Những wiki sau đang sử dụng tập tin này:
- Trang sử dụng tại en.wikipedia.org
- Trang sử dụng tại is.wikipedia.org
- Trang sử dụng tại ku.wikipedia.org
- Trang sử dụng tại pl.wikipedia.org